Setting up Elasticsearch and Kibana for logging.
Introducing logging aspect to the machine learning platform of Target.
Every platform needs a scalable and a robust logging features. This helps in quick debugging of production issues and better visibility to the internal members of the platform. In some cases, the users of the platform might also want to look at what their code is outputting at a line-by-line basis rather than the end result of their workloads. They might also want to "save" their logs for further analysis and the platform must be able to provide that.
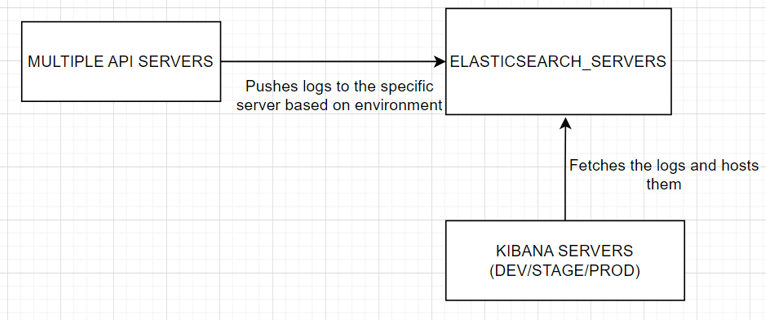
In the early-mid days of the platform, users did not get any logs for their workloads and were only able to get a ML model as the end result. There were options to use a internal tool but it only had a retention period of 5 days. This issue was quickly identified and I took up ownership for this assignment to develop the infrastructure from scratch. This needed several learnings namely, how Elasticsearch and Kibana work together and how to host them.
The solution was to create Elasticsearch databases for each environment and host corresponding Kibana servers for each database. All the logs were generated in training Docker containers, which you can read more about here
A python helper library was created for this purpose. This internal library had functionality to take in logs generated by any Docker container and push it a specific Elasticsearch server. It had additional functionality to create a logs file and push it to a remote location such as Amazon S3, and this file can be downloaded by the user from the UI. The hosted Kibana servers would then display these logs and this link can be provided to the user.
This resulted in many improvements to the platform. The user was able to get a in-depth look into what their workloads are actually doing! instead of just getting the end model and they test the model again for rubrics. This feature become more and more useful as all the servers hosting the platform now switched to using the new infrastructure for pushing and analyzing logs. This helped in better debugging and better visibility for the platform.
I also took ownership to a future feature which was built upon this feature. It was introducing log tracking across various servers. A log ID was generated at very first API server which takes in request from the UI, and passes the log ID along with the request to other other servers and so on. As a result, a single log ID is maintained by the entire platform and this improved the scope of debugging even further.
Time taken to complete (available in production) this feature: 2 - 3 sprints including testing.
Tech stack used: Python, Elasticsearch, Kibana.